RSI is often introduced as a very simple indicator with two fixed levels, above 70 overbought and below 30 oversold. That idea is easy to remember but its not accurate. RSI measures how price moved to reach that level and not if the price is high or low. In other words RSI is a momentum indicator. How RSI is calculated, it compares average gains to average losses over a defined period and produces a value that reflects the balance between buying and selling pressure.
A simple 14-period example makes this easier to understand.
→We calculate using candle closes, so assume the closes are: 100, 102, 101, 104, 102, 103, 105, 104, 105, 104, 105, 106, 104, 106, 107.
→From these closes the 14 changes are +2, -1, +3, -2, +1, +2, -1, +1, -1, +1, +1, -2, +2, +1.
→We then separate gains from losses. In this case, total gains are 14 and total losses are 7.
The initial average gain and average loss for a 14-period RSI are
\[ \text{Average Gain} = \frac{14}{14} = 1 \] \[ \text{Average Loss} = \frac{7}{14} = 0.5 \]Next, relative strength is calculated as
\[ RS = \frac{\text{Average Gain}}{\text{Average Loss}} = \frac{1}{0.5} = 2 \]Then RSI becomes
\[ RSI = 100 – \frac{100}{1 + RS} \] \[ RSI = 100 – \frac{100}{1 + 2} = 100 – \frac{100}{3} = 66.67 \]This means that over the last 14 price changes, upward movement has been twice as strong as downward movement on average, producing an RSI just below 70. RSI does not restart this calculation from scratch on every new candle. After the first value is created, Wilder’s smoothing method is used. Suppose the next close is 109, so the new price change is +2. The updated averages become:
\[ \text{New Average Gain} = \frac{(1 \times 13) + 2}{14} = \frac{15}{14} = 1.0714 \] \[ \text{New Average Loss} = \frac{(0.5 \times 13) + 0}{14} = \frac{6.5}{14} = 0.4643 \]That updates relative strength to
\[ RS = \frac{1.0714}{0.4643} \approx 2.3077 \]and the updated RSI becomes
\[ RSI = 100 – \frac{100}{1 + 2.3077} \approx 69.77 \]The key point is that RSI is not measuring whether price is high or low in an absolute sense. It is measuring the strength of recent upward moves relative to recent downward moves. In this example gains were twice as large as losses over the lookback window so momentum is leaning bullish even though RSI is still below 70.
This is why the standard overbought and oversold can mislead traders. In a healthy uptrend, strong momentum can keep RSI on high levels for long periods while price continues to pump. In a weak market RSI can stay low while price keeps dumping. Traders who fade those conditions too early often end up trading against the trend rather than reading what the indicator is actually showing.
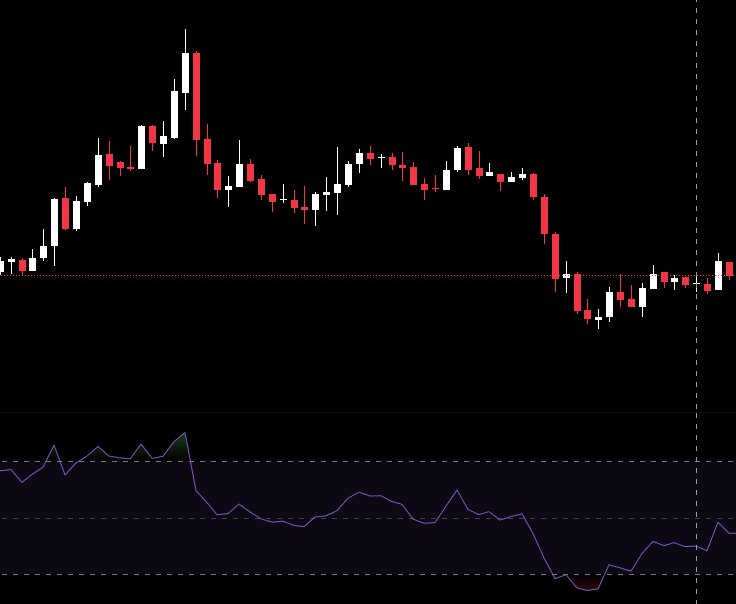
A more useful way to read RSI is to treat it as a tool for momentum context. The 50 level matters because it separates bullish and bearish pressure. When RSI holds above 50, gains are dominating losses over the lookback period. When it stays below 50, downside pressure is stronger. That does not make every cross above or below 50 a setup, but it does help traders see which side has control.
The way RSI moves also matters. RSI rises, momentum is improving, RSI falls, momentum is weakening. This becomes especially important when price continues to push higher or lower while RSI stops confirming the same strength. That loss of confirmation can tell you that the move is becoming less efficient even before price structure fully shifts.
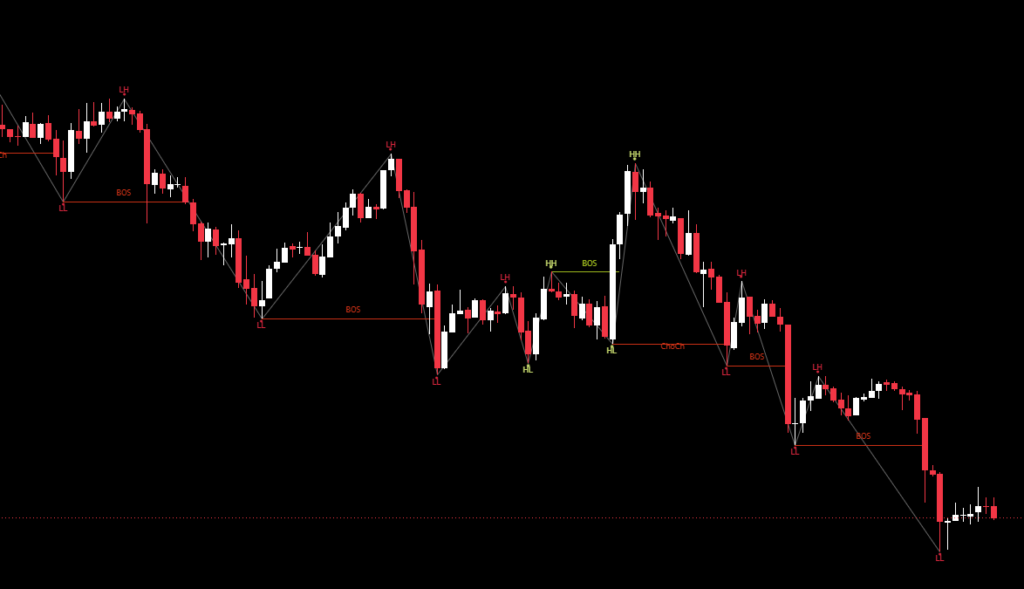
That is where divergence comes in. Bearish divergence appears when price makes a higher high while RSI makes a lower high. Bullish divergence appears when price makes a lower low while RSI makes a higher low. Divergence does not mean automatic reversal it means that momentum is no longer fully supporting the latest extension in price.
This distinction matters in real trading conditions. A market can continue trending higher or lower for some time even while RSI begins to diverge. This is why RSI works best when it is read alongside structure. If divergence appears and price also begins to lose support, fail at resistance, or print a lower high or higher low, the potential of a reversal becomes stronger. Combine RSI with other tools such as MACD to build stronger confirmation around reversals or continuation setups.
Used this way, RSI becomes far more useful.