Many times i find usefull one of the most common technical analysis tools which is Fibonacci Retracement. To apply it simply select the swing low on chart to the swing high. Instantly key retracement levels appear. These are zones that price may reverse. When i have decided to enter a trade i usually check where price stands in Fibonacci.
The most important retracement levels are 0.786 , 0.618 , 0.50 , 0.382 and 0.236.
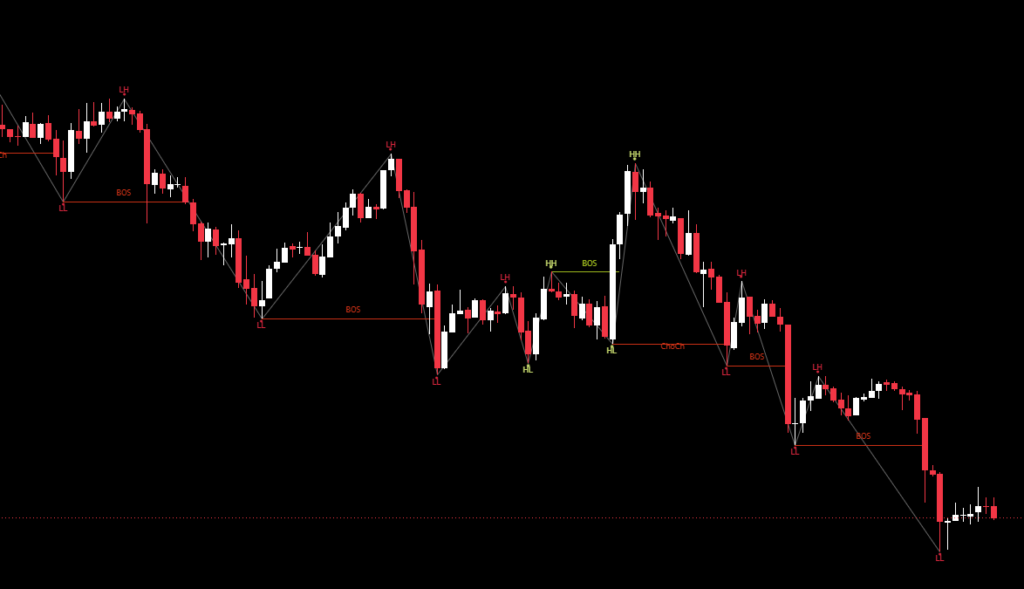
What is actualy happening here is we are tracking the bullish move from swing low to swing high and we expect a pullback to key fibonacci levels before price pushes higher.
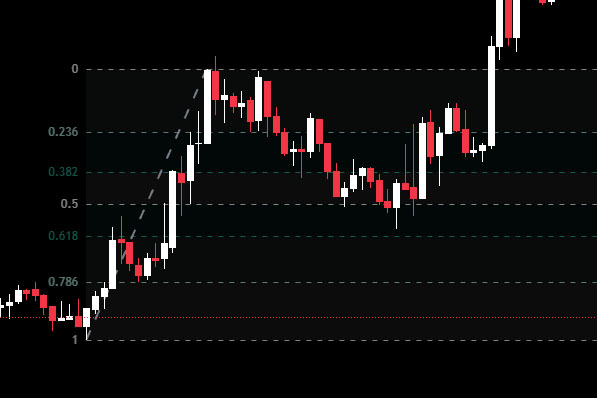
By marking potential retracement levels, you create reference zones for placing strategic orders.
How Fibonacci levels are calculated?
Fibonacci levels are derived from the relation within Fibonacci sequence and the Golden ratio.
Golden ratio φ is approximately 1.618
\[ \begin{aligned} 0.236 &= \left( \frac{1}{\phi} \right)^3 = \frac{1}{1.61803^3} \approx 0.23607 \\ 0.382 &= \left( \frac{1}{\phi} \right)^2 = \frac{1}{1.61803^2} \approx 0.38196 \\ 0.618 &= \frac{1}{\phi} = \frac{1}{1.61803} \approx 0.61803 \\ 0.786 &= \sqrt{0.618} \approx \sqrt{0.61803} \approx 0.78615 \\ \end{aligned} \]
The 0.50 level is not a Fibonacci ratio, it’s a psychological midpoint often used by traders.
Some traders dismiss Fibonacci levels because they come from outside standard charting logic. But I’ve seen them work and like most tools, if you use them with intention they deliver.
Fibonacci sequence
Is a sequence in which each number is the sum of the previous two numbers starting from 0.
| 0 | 1 | 1 | 2 | 3 | 5 | 8 | 13 | 21 | 34 |
As you see above it is really simple to calculate the Fibonacci sequence.
Fibonacci numbers and the golden ratio
Fibonacci numbers are linked to the golden ratio. As the numbers increasing they are approximately 1.618 times larger than the previous number.
| 1 | 1/1 | 1.000 |
| 2 | 2/1 | 2.000 |
| 3 | 3/2 | 1.500 |
| 5 | 5/3 | 1.666 |
| 8 | 8/5 | 1.600 |
| … | ||
| 3,524,578 | 3,524,578/2,178,309 | 1.617 |
| 5,702,887 | 5,702,887/3,524,578 | 1.618 |
| 9,227,465 | 9,227,465/5,702,887 | 1.618 |
| 14,930,352 | 14,930,352/9,227,465 | 1.618 |
| 24,157,817 | 24,157,817/24,157,817 | 1.618 |
| 39,088,169 | 39,088,169/39,088,169 | 1.618 |
Fibonacci retracements work best when you combine them with EMAs. EMAs reveal the structure of the trend how strong it is, where momentum shifts, and where price might pause. Fibonacci levels on the other hand, highlight the pullback zones where that pause can turn into a reaction.
When a Fib level lines up with an EMA, a volume spike, or a clear structure zone that’s confluence. Its the market showing you where traders are positioning. Dont trade Fibonacci just because the lines look clean on the chart trade it when the reaction makes sense when you understand why price should react there. That’s when Fibonacci stops being a drawing tool and becomes part of your strategy.