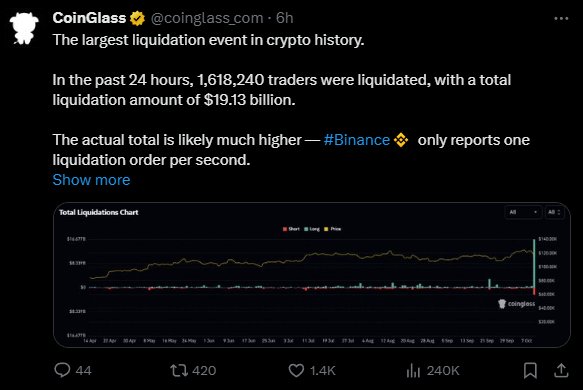
The 10th day of October of 2025 will be remembered as the day $19B vanished. Moves like this aren’t technical, they’re not chart based, and no pattern or setup can warn you. This was pure news-driven chaos. If you were caught in it, the pain was unavoidable and really there wasn’t much you could have done.
The trigger came fast, president Trump announced a 100% tariff on Chinese imports, and the shock hit global risk assets instantly. Within 45 minutes, crypto collapsed. Bitcoin dumped, altcoins evaporated, and $19B in leveraged positions disappeared as if someone flipped a switch.
I watched the charts freeze for a second before they accelerated straight down. Nothing behaved normally, volume meant nothing, delta meant nothing the whole market moved like a broken machine.
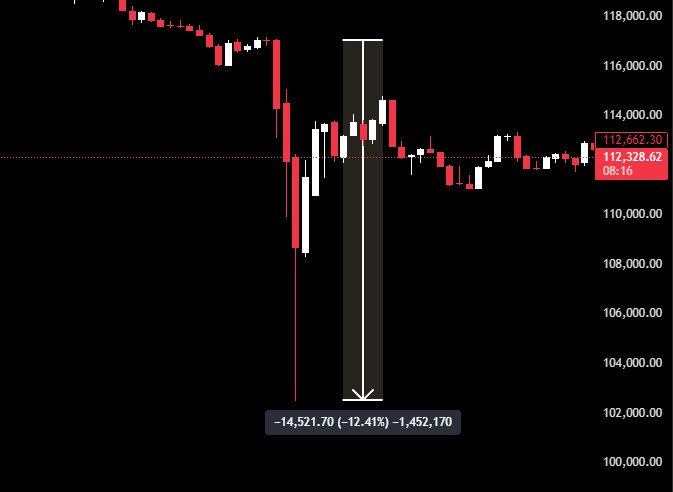
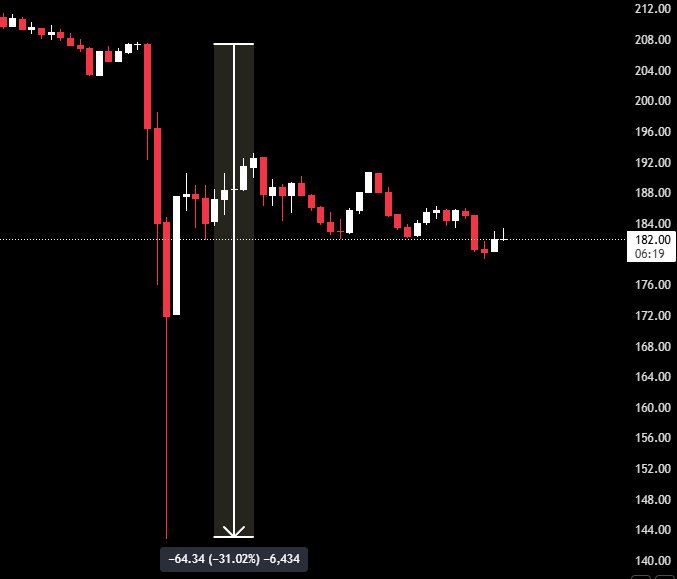
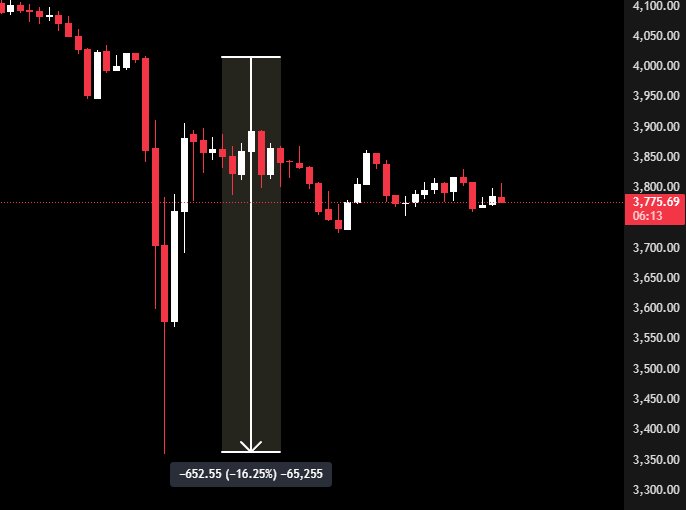
In just 45 minutes, Bitcoin dropped 12%, Ethereum fell 16%, and Solana collapsed 31%. Most altcoins hit between -70% and -90%.
The Numbers Behind the Collapse
→Bitcoin fell 12% in minutes.
→Ethereum dropped 16%.
→Solana bled 31%.
Most altcoins printed -70% to -90% candles not over hours, but inside the same hour.
Since Trump’s second term began, crypto markets have been hit by a series of sudden news driven moves. His announcements whether about tariffs, regulations, or foreign policy tend to shake things up fast. Even when the broader stance seems pro crypto the timing and delivery often trigger unexpected volatility. The recent $19B wipeout is a prime example.
Why the Market Collapsed So Violently
1. The Initial Drop (BTC -2% to -3%)
- The tariff headline hits
- BTC snaps support
- First stop-loss clusters get taken
- Retail tight stops die instantly
- Liquidity thins on the first push
- Pressure accelerates
2. Leveraged Traders Get Exposed
When you see 10×–50× leverage traders sitting near the edge, you know what’s next:
- margin calls trigger
- positions start force-closing
- cascading liquidations begin
At that point, it stops being “selling pressure” and turns into system pressure.
3. Stop Losses Start Failing
The chart was moving faster than the order book could absorb:
- SL orders slipped
- some never filled
- accounts jumped straight to liquidation
Price wasn’t trading it was skipping.
4. Forced Liquidations Hit the Order Books
Once the exchanges start auto-selling collateral, the chart loses all normal structure.
You see candles that don’t make sense anymore.
5. The Order Book Gets Thin
Low-liquidity altcoins drop first -20%, -40%, -70% in minutes. You could feel how fragile everything was one more push and things disappeared.
6. The Feedback Loop Forms
Sell → drop → liquidate → sell again.
Once that loop starts, it feeds itself.
7. Market Makers Pull Back
When MMs pull liquidity, the chart becomes a cliff. Spread widens → depth thins → every hit becomes a freefall.
8. Sentiment Collapses
The panic was immediate the same message repeating across feeds “Everything is gone.”
This is the moment when even strong coins lose their structure and behave like broken charts.
ADL: The Hidden Hammer
Most traders only learn about ADL the day it hits them. Auto deleveraging is the safety valve exchanges use when the insurance fund can’t cover bankrupt accounts during chaos. When that happens, the system liquidates profitable opposite positions to keep the platform stable. You can be winning, doing everything right and still get trimmed or closed without warning. It’s rare, but that’s why parts of the October 10 move felt like a conveyor belt. The system wasn’t just liquidating losers it was reducing winners to protect itself.
How Exchanges Reacted
Binance
Binance struggled through the crash. Outages, delays, order failures the worst possible timing. Some analysts argued that Binance underreported the scale of forced closures, and that its centralized risk engine helped accelerate the cascade instead of slowing it. Whether that’s true or not, the chart behavior during the crash shows one thing clearly, Binance liquidity collapsed when it mattered most.
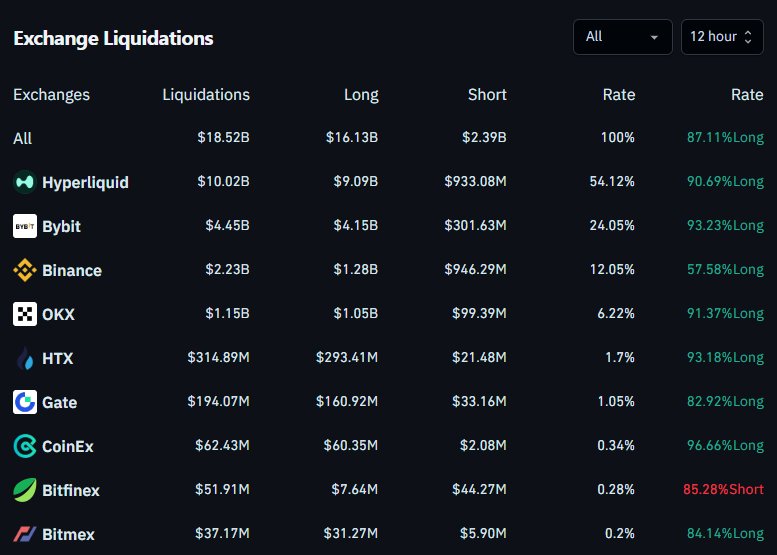
Hyperliquid
Hyperliquid stayed online and ended up processing nearly 50% of all liquidations during the event. Jeff Yan (the founder) publicly accused Binance of publishing fake liquidation numbers to hide the damage which only intensified the conversation. There was also a whale connected to Hyperliquid who allegedly made around $200M from pre-crash shorts, timing like that always raises questions. The platform’s transparency was praised, but its liquidation logic might have been too aggressive, adding fuel to an already dying market.
Everything about that day confirmed one thing for me:
there are moments where charts don’t behave like charts.
→Momentum fails.
→Delta lies.
→Volume becomes meaningless.
→And every support level is just decoration.
These are the days that remind me why I always treat leveraged exposure with suspicion, and why I never assume the chart will respect any level when the world outside hits it with a hammer.