Cryptocurrency markets operate 24/7 with no official opening or closing times, unlike traditional stock exchanges. However, trading activity, liquidity, and volatility tend to follow global regional sessions influenced by major financial hubs (similar to forex markets). These sessions are commonly referred to as the Pacific, Asian, European, and American (or US) sessions.
| Session | UTC Time | Key Hubs | Characteristics |
|---|---|---|---|
| Sidney (Pacific) | 21:00 – 06:00 | Sydney, Wellington | Lowest volume. Quiet transition from US close. Ideal for low-risk positioning or avoiding whipsaws in crypto pairs. |
| Tokyo (Asian) | 00:00 – 09:00 | Tokyo, Hong Kong, Singapore | Moderate activity. Focuses on JPY-influenced assets. Crypto sees steady but range-bound moves, with potential for early breakouts. |
| London (EU) | 07:00 – 16:00 | London, Frankfurt | High liquidity surge. Trend formation ramps up. Great for crypto scalping or following momentum from Asian close. |
| New York (USA) | 13:00 – 22:00 | New York, Chicago | Peak volatility. News-driven swings (e.g., US economic data). Often the most profitable for crypto day trading, with major BTC/ETH moves. |
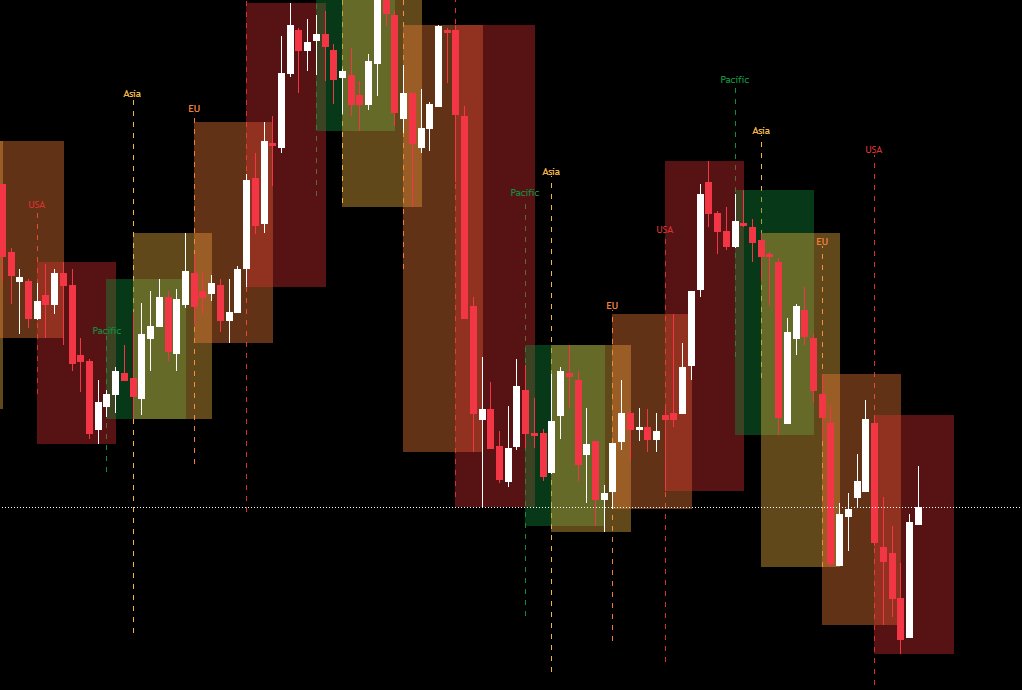
I have created an indicator in TradingView color coding each one of the 4 sessions named Crypto Sessions v1.0. The indicator is designed to visualize and track the four major trading sessions. It highlights the Pacific (Sydney), Asia (Tokyo), EU (London) and USA (New York) sessions each with its own distinct color for easy idenitifition.
At the start of each session the script draws a vertical dashed line in the session’s color to mark the beggining, with a simple label floating above. As the session progresses it dynamically creates a semi-transparent box that spans the session’s duration. The boxes overlap where sessions coincide.